
How to Backtest a Funding Rate Strategy (and Read the Results)
A practical guide to backtesting funding arbitrage: choosing the window, adding execution cost, reading P&L, drawdown and average APR, and spotting spreads that will not last.
A live funding spread tells you what is happening now. A backtest tells you whether it would have made money over weeks or months. It is the cheapest way to avoid a bad trade.
What the backtester does
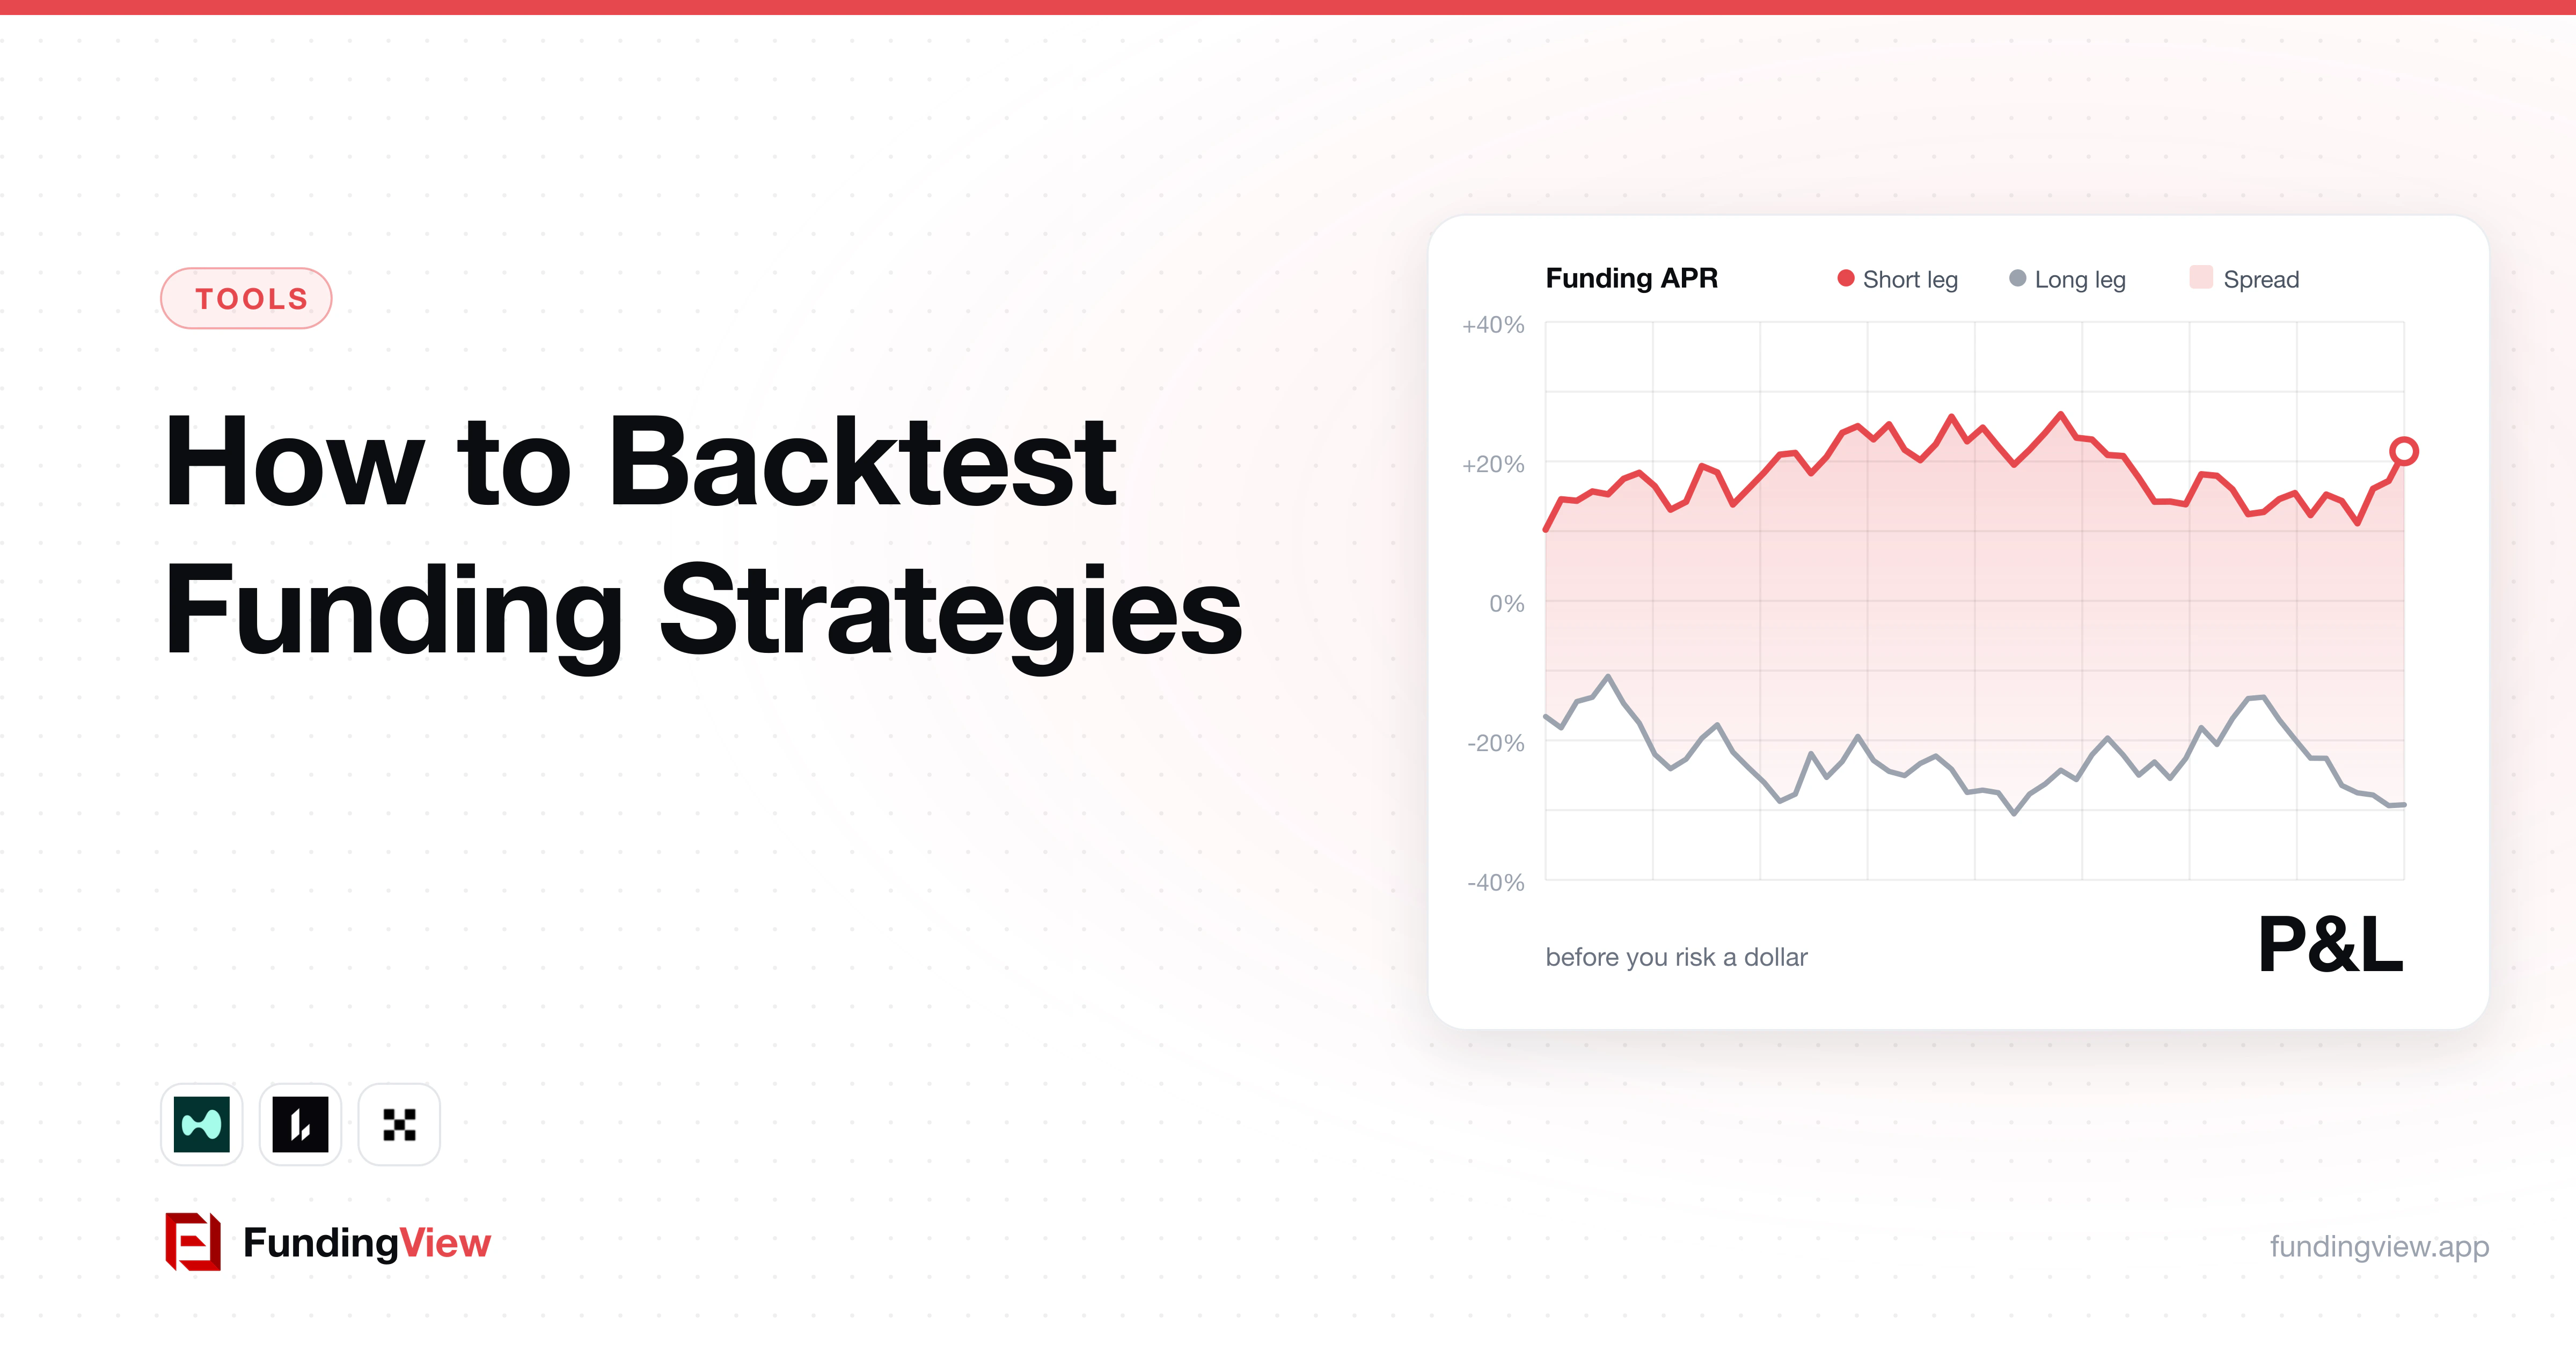
Pick an asset, a long venue, a short venue and a position size. The backtester replays real funding history for both legs and simulates the P&L:
- the funding you would have received or paid on each leg, at its real settlement hours (an 8h market only pays every 8 hours);
- minus the execution cost you enter, in basis points, for opening and closing;
- shown as a P&L curve, total return, average APR and maximum drawdown.
Step by step
- Choose the pair. From the dashboard, click "Backtest" on a row, or set the legs manually.
- Pick the window. 30 days is the minimum to judge stability. 90 and 180 days show how the spread behaves across market phases. Premium lets you set custom periods.
- Enter your size. It changes execution cost, not funding.
- Enter execution cost. Use the Execution Cost page for your size on each venue.
- Read the result.
How to read the result
- Average APR: the realised spread over the window. Compare it with today's live spread. A live spread far above the historical average is likely to fall.
- P&L curve shape: a steady line is a durable spread. A flat line with one jump is a spike you would probably have missed.
- Maximum drawdown: how much the strategy lost from its peak, from funding flips and costs.
- Last month vs whole window: is the spread fading?
Common traps
- Survivorship: pairs that look great today are often the ones that just spiked. Check the whole window.
- Too-short windows: 3 or 7 days say almost nothing.
- Zero execution cost: always enter realistic costs.
FAQ
How far back does history go? Depending on the venue, from several months to more than a year. OKX funding goes back to January 2026, and newer venues are recorded hourly since they were added.
Why does the backtest differ from the live APR? The backtest averages the real rate over time. The live APR is a snapshot.
Related: Funding rate arbitrage guide · Execution cost and slippage